Project: Practice Debugging
In order to practice debugging, it is useful to practice some debugging using the Vue-Devtools in our browser. We can work from the same project we used for the last section, or if we prefer we can clone out the finished version of that project from the Github repository.
Once we have the project skeleton we want to work with, we can begin exploring some of the ways we can use our debugging tools. Run the development server so we can see our project in the browser, and then open up Vue-Devtools so we can inspect our application more closely.
NOTE: You can only use the Vue-Devtools when running a project with a Dev Server.
Watching Values
In the Vue-Devtools main tab we should see the components of our application. When the page initially loads the product value has not yet been calculated. It has been initialized to null. We can see that in the Vue-Devtools:
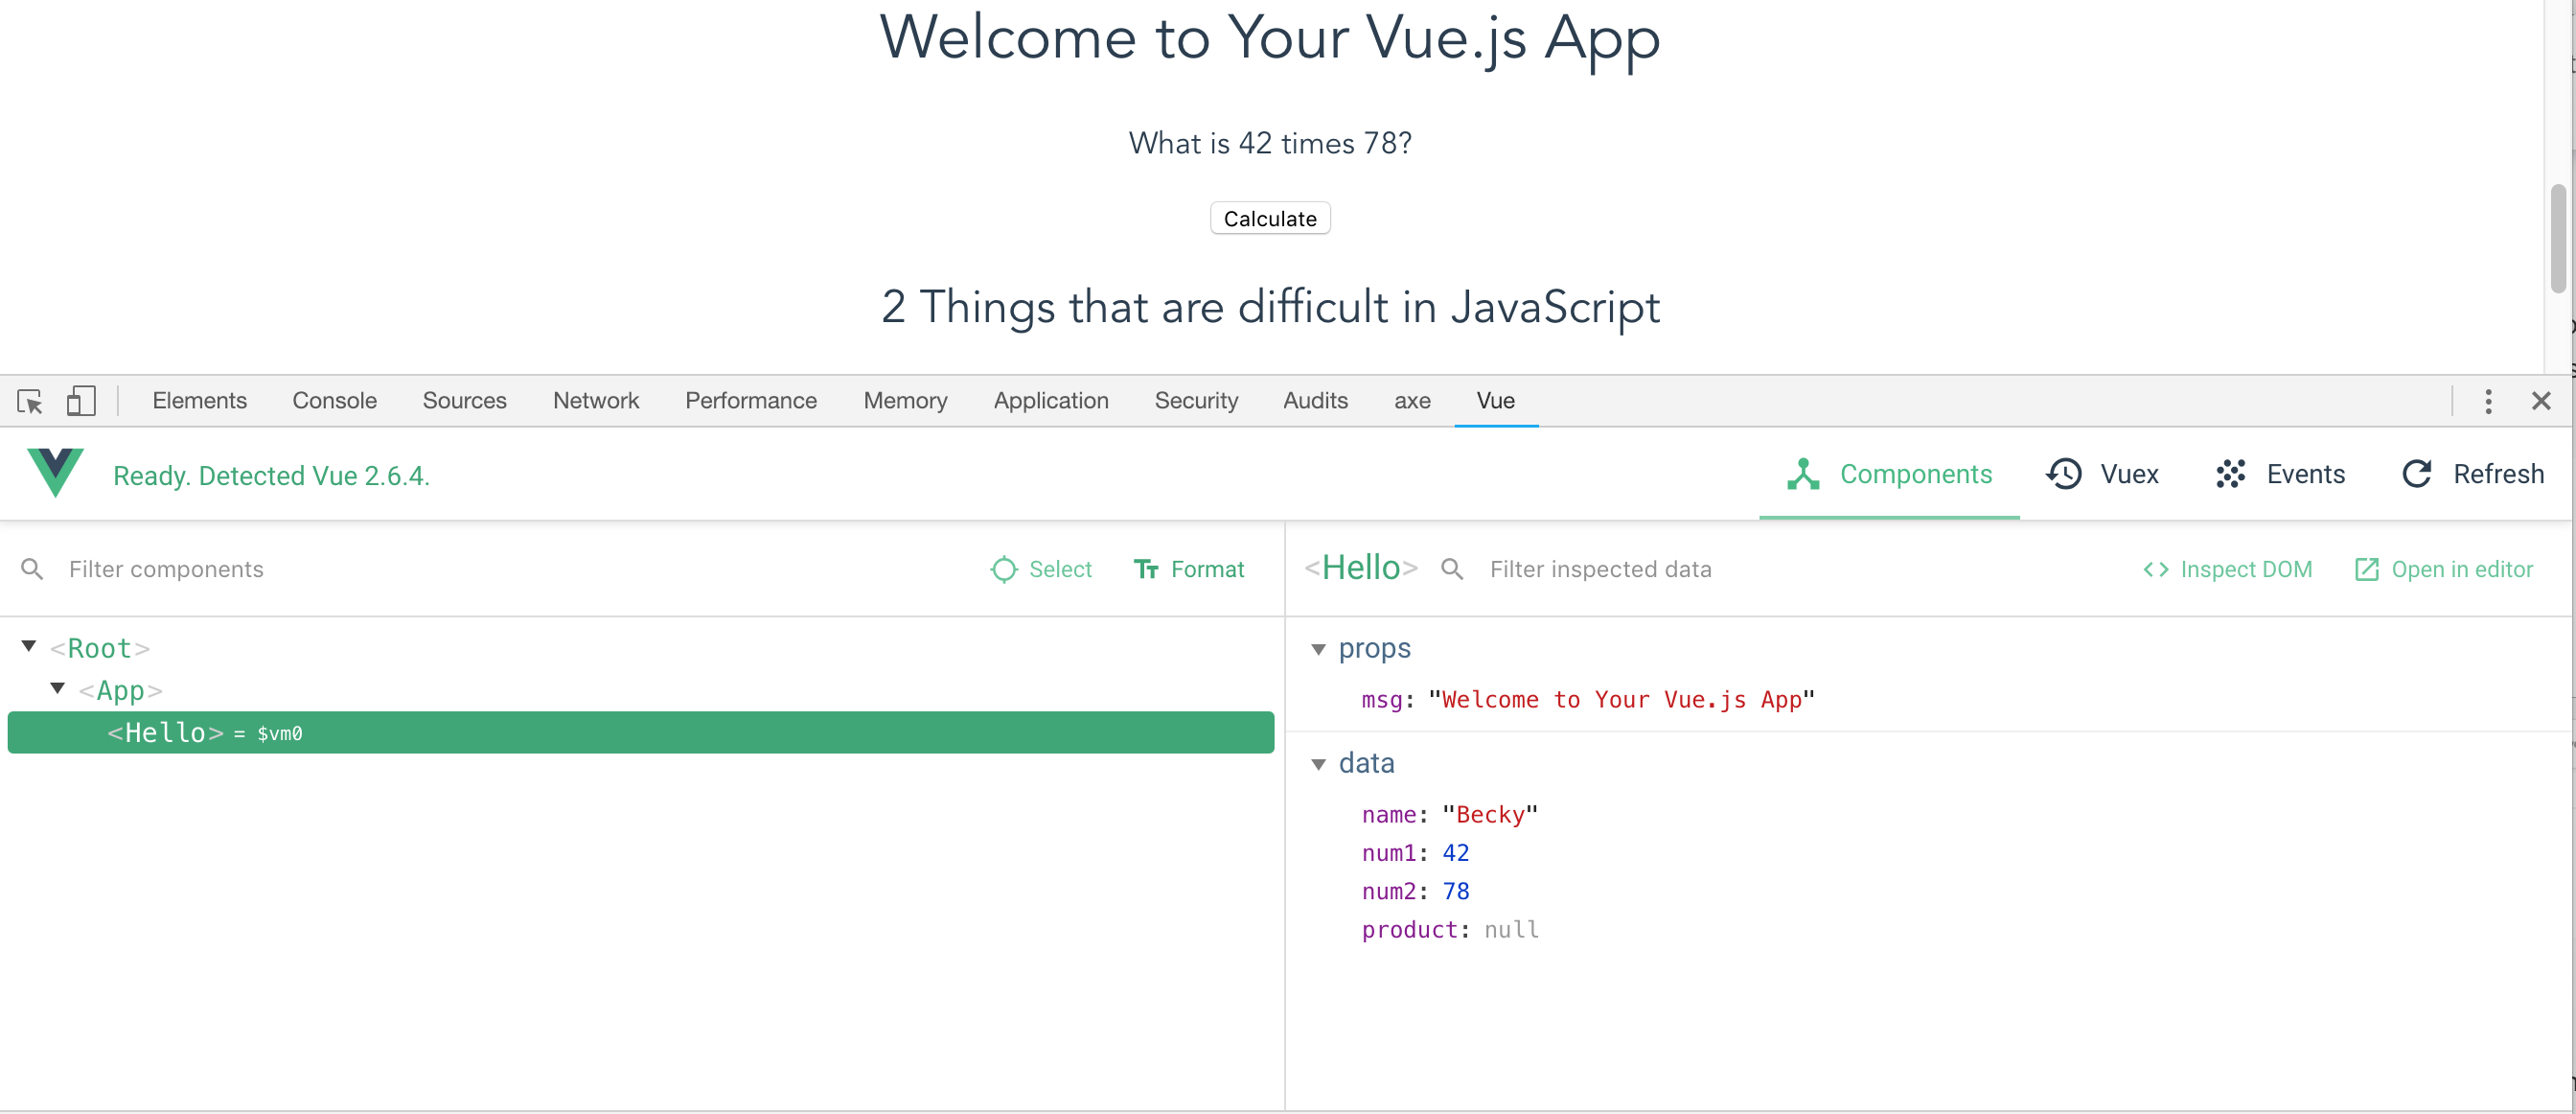
App values before product calculation
If we keep the Vue-Devtools panel open, we can watch the value change when we click the Calculate button:
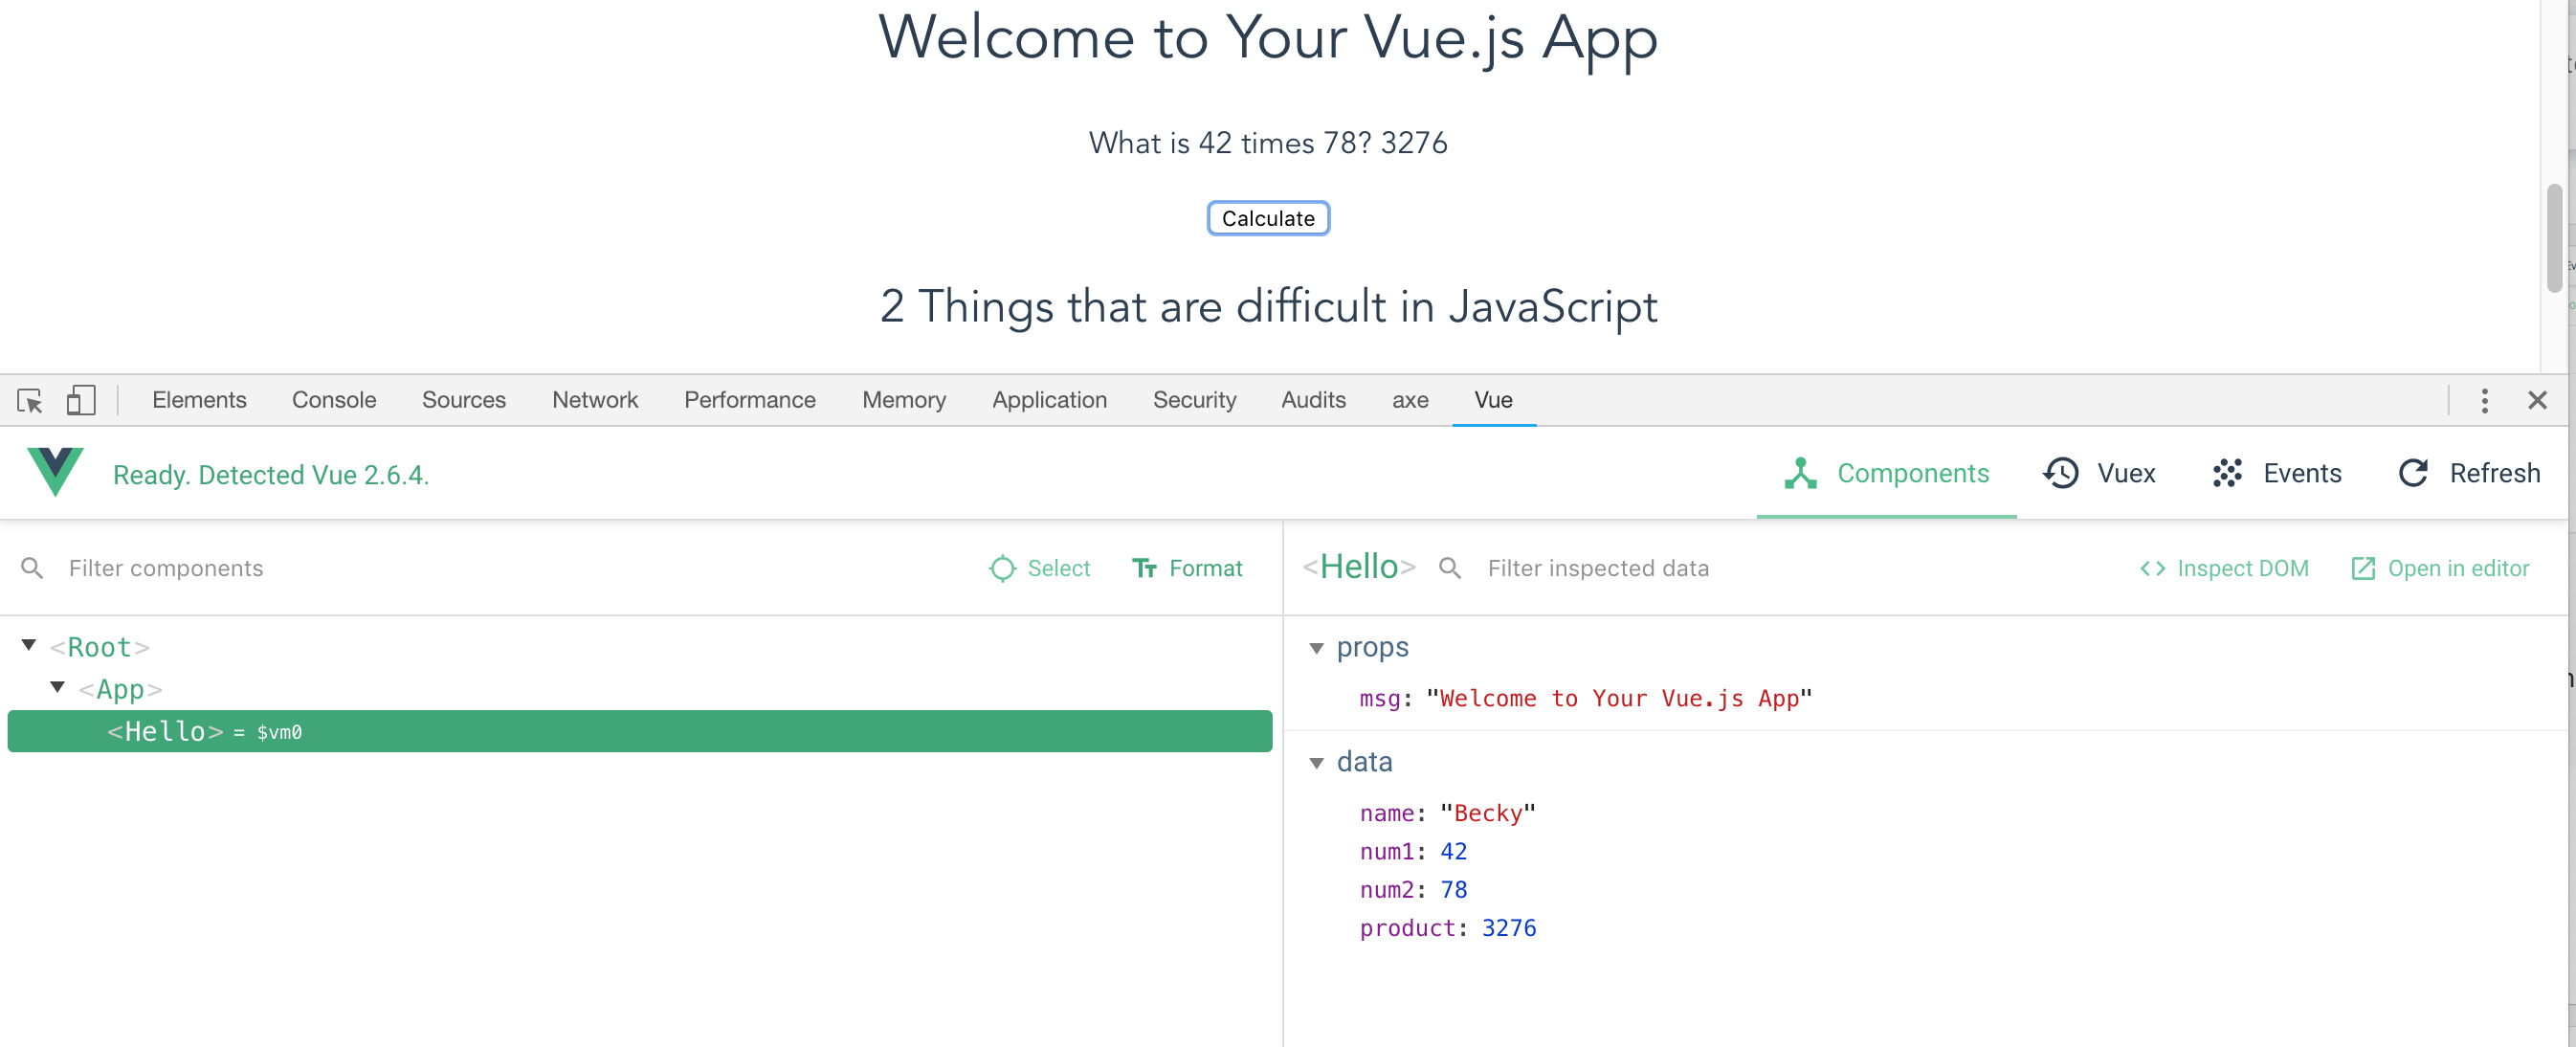
App values after product calculation
As we can see, the values that are exposed to our templates are always shown to us and updated in real-time. This allows us to watch those values change as we interact with our applications. This an immensely helpful feature as we develop new components and functions.
Catching Syntax Errors
Some of the most frustrating errors as new developers are syntax errors. These are caused by misplaced commas, semicolons, curly braces, etc. Every piece of punctuation matters to the JavaScript interpreter, and it is limited in how much it can "just figure things out" when we get fast and loose with our syntax.
If we add a syntax error to our file (in this case a semicolon has been improperly added inside the data object), we will get the error reflected in the web browser:
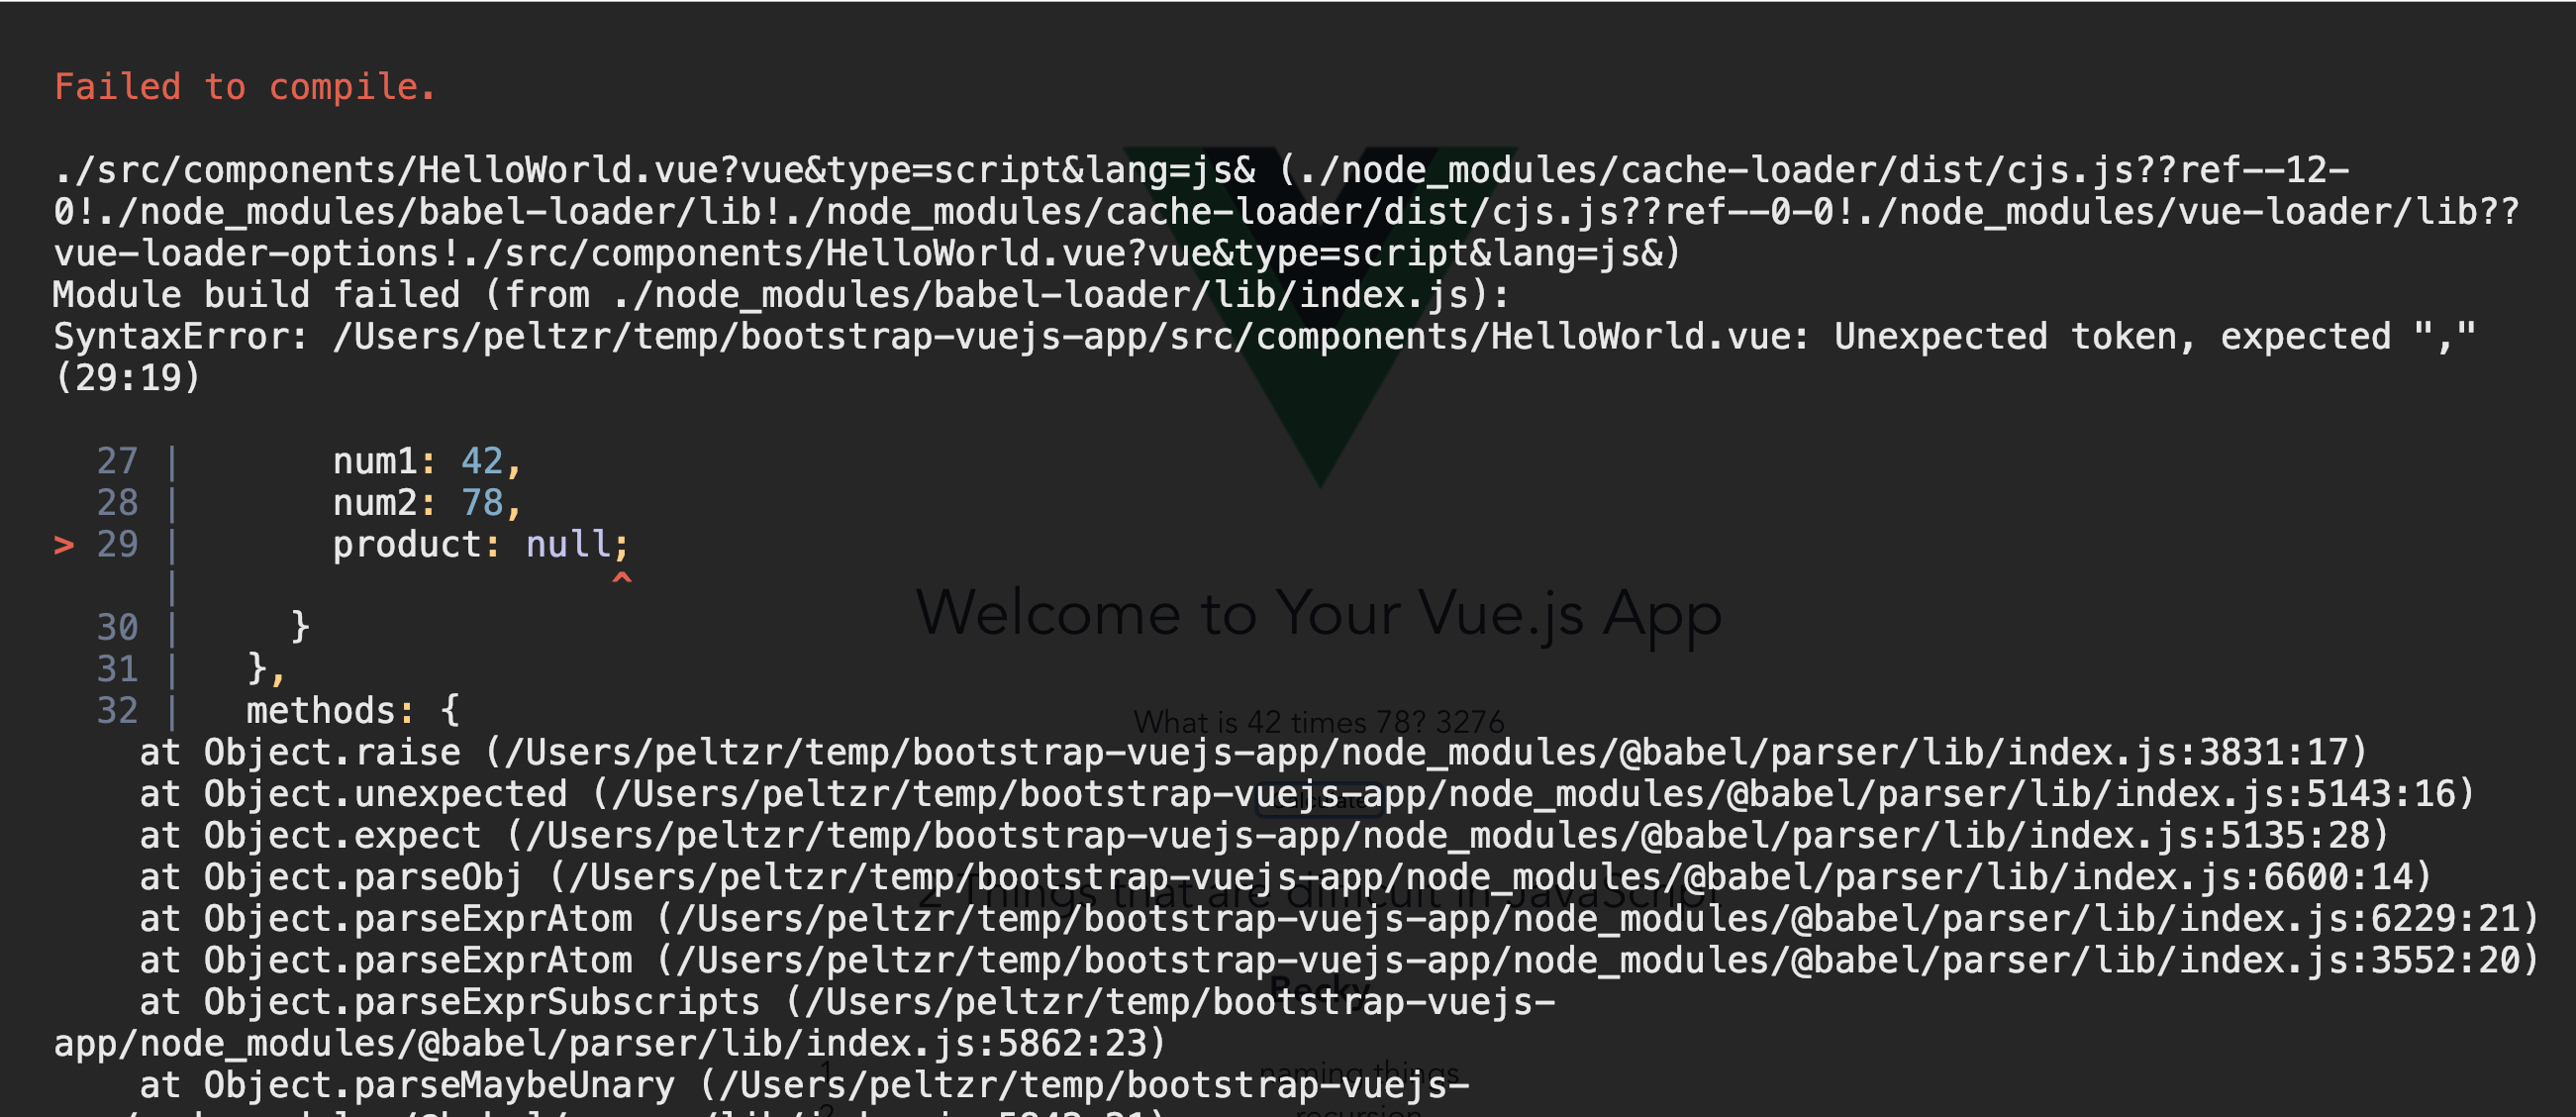
Syntax error showing in browser
This is a very handy feature of the way the development server is configured on the project skeleton. We can see that the error message actually makes it very clear where the syntax error has occurred. The line and column numbers are given in text (SyntaxError: Unexpected token, expected , (29:19)), and then the actual lines of code are shown with a red caret (^) indicating the position of the error.
Not all syntax errors are as obvious as this one, but the ability to see these errors made prominent in the web browser will help us be alerted to mistakes we make and correct them more quickly.